The UTXO "Clean-Up" Mirage: Inside the June Consolidation and the Myth of July Relief

June was a bloodbath. Spot buyers who swallowed the institutional marketing packet whole got absolutely shredded. For 30 grueling days, Bitcoin did nothing but grind downward, bleeding out slowly until it finally slammed into the $58,000–$60,000 support floor like a lead weight dropped from a skyscraper. Liquidations cascaded.
While institutional marketing teams spent the entire month of June pumping out glossy PDF reports trying to convince retail buyers that the consolidation down to $58,560 was nothing but a healthy structural flush, the raw on-chain transaction logs tell a far more cynical story—one where spot ETF desks quietly offloaded their stale inventory directly into the hands of naive dip-buyers who actually believe that historical July relief is a guaranteed laws-of-physics certainty.
Inventory is moving.
Fast.
I’m looking at the primary on-chain metrics driving the current round of institutional hopium. The desperation is palpable. Analysts are screaming about the UTXO Block P/L Count Ratio Model. They claim it’s a bottom.
Let’s define the jargon. A UTXO—or Unspent Transaction Output—is just the unspent change sitting in your digital wallet. Think of it as loose dollar bills. The P/L Ratio Model counts how many of these digital bills are currently green versus how many are drowning in red ink. Right now, the crowd thinks the ratio is screaming “buy.”
It isn’t.
They think “oversold” means a mandatory bounce. That’s a joke. An on-chain ledger doesn’t care about your feelings, and it certainly doesn’t force buyers to step up just because a line on a chart crossed a magic threshold; all it’s actually recording is the slow, agonizing sound of top-buyers capitulating and locking in their financial ruin.
Look at the daily. There’s a massive, textbook bullish RSI divergence on the chart. Price made a lower low, printing a candle wick down to $58,310.00 on June 30. However, the 14-day RSI printed a higher low at 30.11, staying well above the deeply oversold bottom of 15 recorded during the initial dump on June 5.
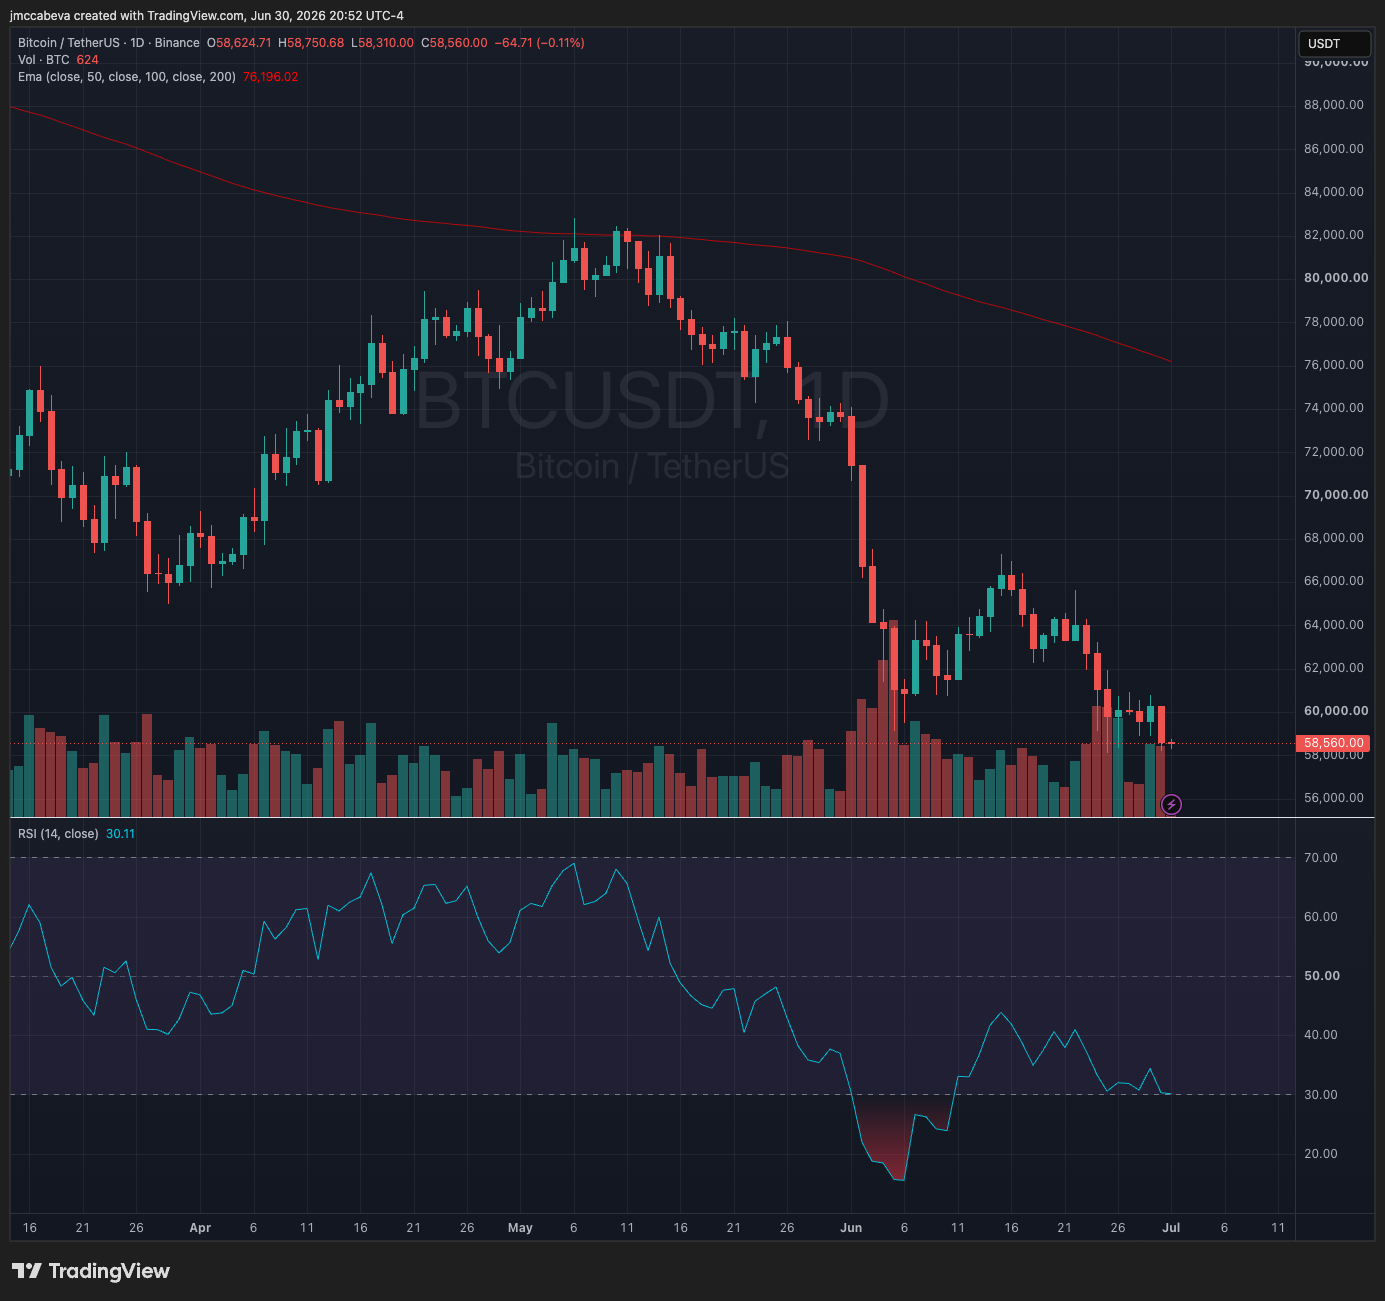
It’s a classic signature of seller exhaustion. Compounding this, the daily volume bars on this late-June drop are microscopic compared to the massive liquidation spikes from early in the month. The selling pressure is drying up. But a line on a chart can’t buy spot Bitcoin. Spot ETF flows are negative. Capital is fleeing.
Meanwhile, the 200-day EMA looms above the price action at exactly $76,196.02, serving as a massive concrete ceiling. Because Bitcoin is trading nearly 23% below this long-term trend boundary, the macro regime remains completely bearish. Any short-term squeeze is just a corrective bounce inside a larger bear cage until that red line is reclaimed.
If you’re buying the July relief narrative, you’re betting that institutional market makers are feeling charitable. They aren’t. They’re simply waiting for enough retail liquidity to accumulate near the local lows before they sweep the deck once more.
Math always wins.

Copyright © 2017-2026 James McCabe | ModernCYPH3R. All rights reserved.
No part of this publication—including text, original data analysis, or visual assets—may be reproduced, distributed, or transmitted in any form or by any means, including electronic or mechanical methods, without including credit to the author. ModernCYPH3R and ModernCYPH3R.com are the exclusive intellectual property of JMc Associates, LLC.